
The Data Stack of a Serious Skin Trader
The difference between a trader and a hoarder is not conviction — it's instrumentation. Here's the tooling that replaces "I feel like cases are up" with a number.
Why gut feel fails in this market
The CS2 economy is fragmented across a dozen venues, none of which agree on price. Steam shows numbers inflated by its ~15% fee and wallet lock-in; Chinese platforms often set the marginal price for liquid items; European cash markets trade at their own discount. An item doesn't have a price — it has a price surface, and eyeballing one venue means trading against people who see the whole surface.
The good news: almost every layer of that surface is observable with free or cheap tooling. The stack below is roughly what any serious holder runs as of mid-2026. None of these links are affiliate anything — this is just the standard kit.
Layer 1: price aggregation
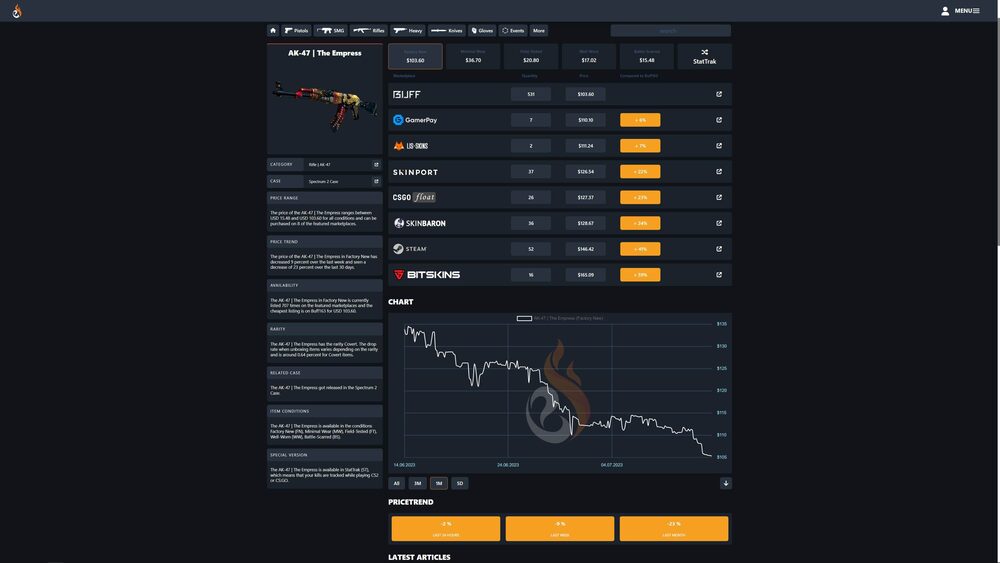
Aggregators pull listings from Steam, Buff/YouPin, CSFloat, DMarket, SkinBaron and others into one row per item. Pricempire is the best-known example of the category; several competitors do a similar job. What you actually use them for:
- Cross-venue spreads. When the gap between a cash market and Steam widens beyond its usual range, that's information — usually about cash-out pressure or regional demand, a dynamic covered in where CS2 skins actually trade.
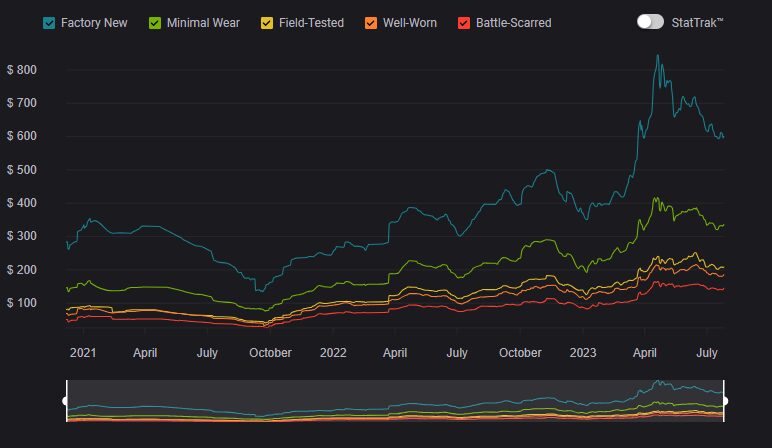
- Historical charts. A three-year chart tells you whether today's price is a spike or a trend. Most bad buys happen because someone saw only the last thirty days.
- Liquidity proxies. Listing counts and sales-per-day matter as much as price. A "worth $500" item that sells twice a month is not worth $500 to you — see liquidity, explained.
One discipline habit: pick a single reference price source and account in it consistently. Switching between Steam prices and cash prices depending on which flatters your portfolio is self-deception with extra steps.
The aggregators' alert features also deserve more use than they get. A price alert set at your pre-decided buy ceiling or exit level outsources the vigil to a machine — and, more importantly, it timestamps the decision before the market can argue with you. Set alerts when you're calm, act on them mechanically when they fire, and export the history to a spreadsheet once a quarter so you can audit whether your own triggers actually made money.
Layer 2: float and pattern inspection
For anything beyond sealed cases, the item-level attributes are where the money hides. Float values and pattern seeds can move a price by multiples, and they're all readable from the item's inspect link. CSFloat's inspect tooling became the de facto standard for checking float, paint seed, and applied stickers; pattern-tier databases (blue-gem percentage rankings, fade percentages, Doppler phase guides) sit on top of that raw data.
The practical rule: never price a skin from its name alone. Two Case Hardened AKs with the same wear tier can differ by two orders of magnitude. If you trade skins rather than cases, an inspect-link habit is not optional.
Layer 3: inventory and supply tracking
Two different jobs here. The first is your inventory: trackers that read your Steam inventory (and storage units, with some effort) and mark it to market daily. This is what turns "I have a lot of cases" into a portfolio with a cost basis, a current value, and a drawdown history. If you accumulate via DCA, hundreds of small buys make manual tracking hopeless — the ledger has to be automatic.
The second is global supply: case supply trackers estimate how many units of each case exist by sampling inventories and watching listing volumes. They're imperfect — the methodology problems are real, as covered in how do you measure a market nobody audits — but directionally they're the best view of the burn rate that drives case appreciation.
| Layer | Question it answers | Typical tools |
|---|---|---|
| Price aggregation | What does this sell for, where? | Pricempire and similar aggregators |
| Float / pattern inspect | What is this specific unit worth? | CSFloat inspect, pattern databases |
| Inventory tracking | What am I holding and what's my P&L? | Inventory value trackers, your own ledger |
| Supply tracking | How fast is the float shrinking? | Case supply trackers |
What the stack can't tell you
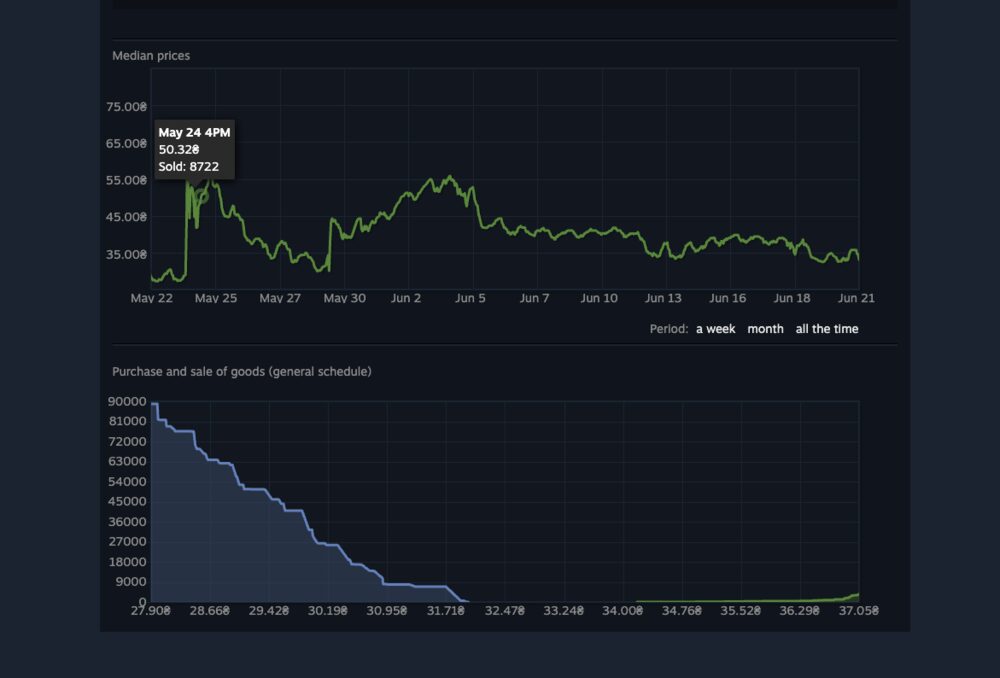
Worth being honest about the limits. No tool predicts Valve: a single patch note can reprice everything at once, as every major update has demonstrated. Aggregated prices can also embed wash trading on smaller venues, and sales history on illiquid items is thin enough that a single motivated buyer distorts the chart. Data narrows your uncertainty; it doesn't remove the platform risk that defines this market.
The synthesis: the stack's job is to make your decisions boring. Price checks before every buy, a ledger you didn't hand-type, and a supply chart to sanity-check the thesis. Everything else is entertainment.