
CS2 Skins vs the S&P 500: Five Years of Returns
A basket of discontinued cases bought in 2021 beat the world's most famous stock index — and it isn't close. The interesting part is everything the raw comparison leaves out.
The scoreboard, 2021–2026
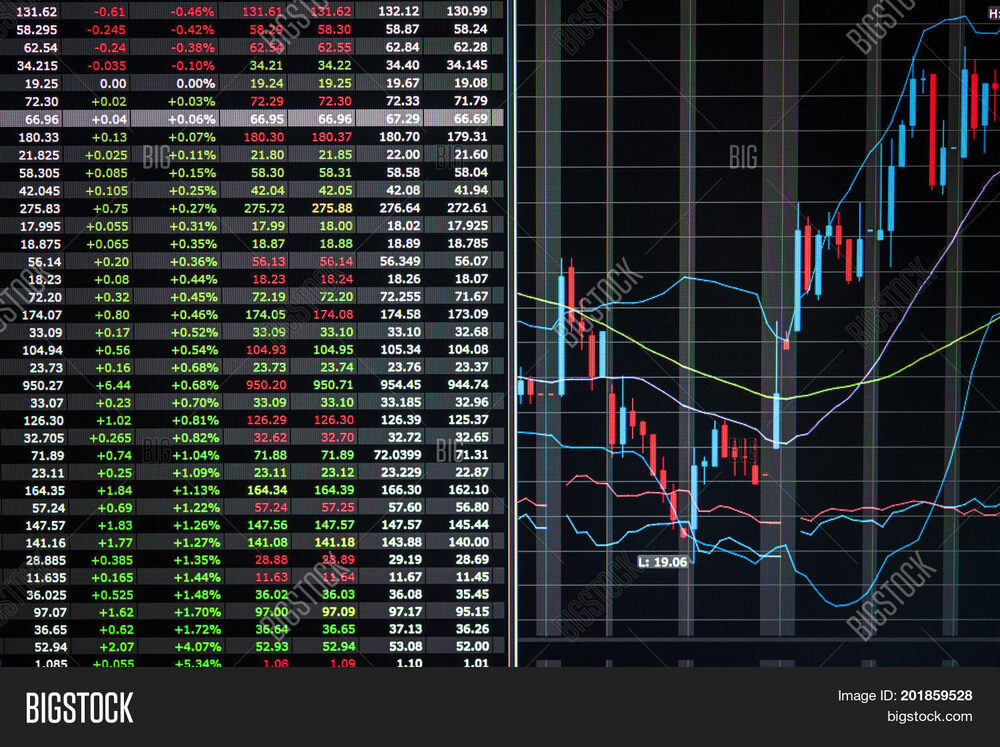
Start with the blunt version. The S&P 500 roughly doubled over the five years to early 2026 including dividends — a strong stretch by historical standards, something in the neighborhood of 12–15% annualized. Over the same window, per third-party price trackers, broad baskets of discontinued CS2 cases returned multiples of that: many individual cases did 5–10x, and community case indexes compounded at rates estimates put around 30–40% per year. Even after the 2025 trade-up shock knocked parts of the market down hard, the five-year scoreboard isn't a contest.
The drivers were specific and, in hindsight, legible: the CS2 announcement and launch in 2023 triggered one of the biggest bull runs in skin history, player counts kept setting records, and discontinued cases kept getting structurally scarcer as openings burned supply. Equities had a good half-decade; cases had a supply squeeze colliding with a demand boom.
Worth stating plainly before the caveats: this isn't cherry-picking a single moonshot item against an index. The comparison holds for boring, diversified case baskets — the skin market's equivalent of buying the index. The cherry-picked version (a Katowice 2014 capsule, a blue gem) isn't a comparison at all; it's a lottery ticket anecdote, and we're ignoring it.
What the raw comparison misses
If the story ended there, every index fund investor would be a fool. It doesn't. The honest comparison is a list of asymmetries, almost all favoring the S&P:
- No cash flows. S&P companies pay dividends and buy back shares; the index has an earnings engine under it. A case produces nothing. Its return is purely the next buyer's willingness to pay — closer to a collectible than a security.
- Platform risk vs diversification. The S&P spreads you across 500 companies and decades of legal precedent. Every skin depends on one privately-held company's goodwill, one game's popularity, and terms of service that say you don't legally own the items. Valve has repriced the whole market with a single patch note more than once.
- Realizable value. An S&P sell order settles to cash at the quoted price. Skin "prices" are venue-dependent: Steam listings run 20–30% above real cash prices because Steam wallet dollars aren't dollars, and cashing out means fees, discounts, and patience. Tracker returns are quoted in prices few holders fully realize.
- No regulation, no recourse. No SIPC, no audited data, no one to call. Scams and platform failures are absorbed by the holder.
- Survivorship in the data. Case indexes are built from items that still trade and still get tracked. The equity comparison has survivorship too — but it's measured; skin-tracker survivorship mostly isn't.

Drawdowns: pick your poison
Volatility is the other half of return, and here the profiles genuinely differ. The S&P's worst modern drawdowns run 30–50% and take months to unfold. Skin drawdowns are sharper and weirder: the May 2025 update reportedly took double-digit percentages off broad market value within hours, and single categories (knives, gloves) fell much harder. But recoveries have historically been fast too, because the supply mechanics don't stop working during a panic — cases keep getting opened, scarcity keeps compounding.
The S&P's risk is the economy. A case's risk is one company's changelog. You can diversify the first. You cannot diversify the second — not inside this market.
That last point deserves weight. During Valve-driven shocks, everything in the skin market correlates at once; diversifying across skin sub-classes softens item-specific risk but not update risk. The S&P investor's tail risk is a recession. The case investor's tail risk is a decision made in Bellevue on a Tuesday.
Fees, frictions, and the round-trip problem
One more asymmetry that compounds quietly: transaction costs. An index fund round-trip costs basis points. A skin round-trip is brutal by comparison — sell on Steam and Valve takes roughly 15% into a wallet the money can never leave; sell for cash on a third-party venue and you're paying venue fees plus the structural cash-out discount, often a total haircut in the 10–25% range depending on item and patience. That drag doesn't show up in tracker index charts, but it shows up in every real portfolio. It also changes optimal behavior: skins punish trading and reward holding, far more than equities do. The investors who captured the tracker-level returns of 2021–2026 were overwhelmingly the ones who bought and sat still, not the ones who rotated positions chasing each narrative.
Taxes stack on top for many jurisdictions — realized skin gains are increasingly treated like any other property gain, a topic with its own set of questions — and unlike a brokerage, no marketplace is mailing you a clean annual statement. The record-keeping burden is yours.
The verdict, honestly stated
As of mid-2026, the five-year return contest goes decisively to skins — that's simply what the trackers show, hedged as their data deserves. The risk-adjusted, sleep-adjusted, realizability-adjusted contest is far closer, and for most of anyone's net worth the boring index remains the correct default. The rational frame isn't either/or: skins earned a place in the conversation as a satellite alternative asset — a small, deliberately-sized slice with return potential equities can't offer and risks equities don't have.

And if you take that slice, the equity world's best habit transfers directly: nobody times the S&P successfully, and nobody times Valve either. Steady, spread-out accumulation — the same DCA logic index investors swear by — is how you own volatility instead of being owned by it.