
Case Stacking Returns: What the Numbers Actually Show
Every case-stacking pitch leads with a chart that goes up and to the right. The chart is usually real. What gets cropped out is the part where it went down 40% first, stayed there for a year, and shook out everyone who sized wrong. Here's the honest version of the returns story.
The headline numbers, with the necessary asterisk
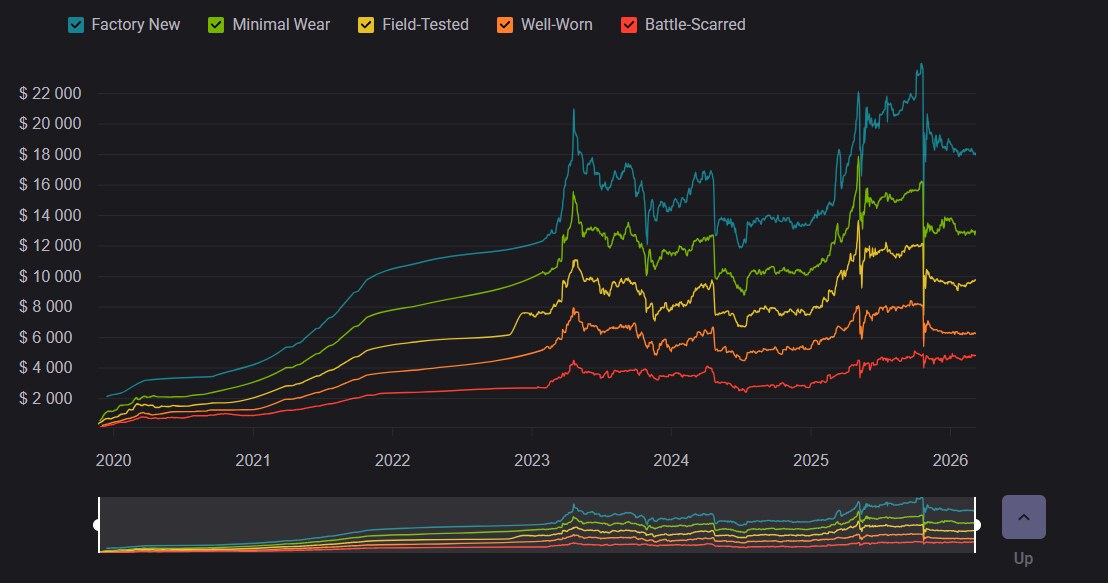
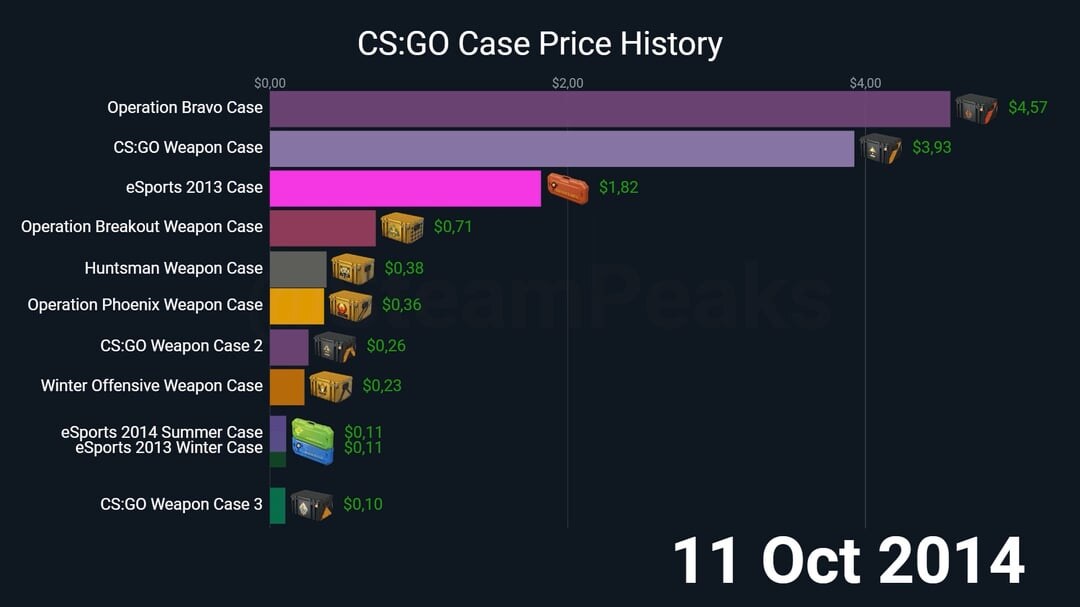
Per third-party price trackers, several discontinued cases have multiplied in price many times over across a multi-year hold. Cases that once dropped freely and traded for pocket change have, in some generations, ended up costing more than the skins most people pull out of them. The oldest series — the original weapon cases and early operation cases — show the steepest long-run paths, which is exactly what the supply-shrink thesis predicts: opened cases leave the market forever, drops of old cases dwindle, and price gets set by the remaining float.

The asterisk: none of these numbers come from an audited exchange. They come from marketplace scrapers and community trackers, they differ venue to venue, and they describe the path of a specific case bought at a specific time. Survivorship bias is doing real work in every highlight reel — the cases people screenshot are the ones that worked. Treat any precise "case X returned Y% per year" claim as an estimate with wide error bars, not a fact.
What the path actually looked like
Averaged over enough years, the trajectory of a liquid, aging case has historically been up. Lived day to day, it was ugly. The same trackers that show the multi-year gains also show the interruptions:
- Update shocks. Valve has repriced the entire market with a patch note more than once. The October 2025 trade-up update moved Covert skins and knife prices within days of the announcement — up for some holders, brutally down for others. Case prices react to these events because the knife pool anchors what unboxers will pay.
- Macro-of-the-microcosm crashes. The market has had genuine crashes — see the ranked list — where broad case prices reportedly fell by double-digit percentages in weeks. Recoveries happened, but on the market's schedule, not the holder's.
- Long flat stretches. Less discussed than crashes and arguably harder to sit through. A case can do nothing for many months. Stackers who needed action quit during the boring parts, not the scary parts.
This is why drawdown math belongs next to every return chart. A position that drops 50% needs to double just to get back to even, and a stacker who panic-sold the dip locked in the loss that the chart later papered over.
Time in market did the heavy lifting
Strip away the specifics and the historical pattern is consistent: the returns accrued to people who held through full drop cycles, not to people who timed entries. A case's biggest repricings tended to happen after it left the active drop pool — a date nobody controls and few predict — and the years-long grind between "still drops occasionally" and "genuinely scarce" is where impatient money exited to patient money.
That has two practical consequences. First, horizon matters more than selection: per third-party data, most liquid cases held for several years did fine, while most cases traded on a six-month view were a coin flip minus fees. Second, entry price matters less than entry consistency. Buying a fixed amount daily or weekly — dollar-cost averaging — meant the crashes in the middle of the chart lowered your average cost instead of defining your outcome. A correction is a discount to an accumulator and a catastrophe to a lump-sum buyer with no stomach.

What a realistic expectation looks like
Ranges, not points. Based on the trajectories third-party trackers show across case generations, a sober read looks something like this:
- Cheap, high-supply modern cases have historically spent years near their floor before scarcity mattered. Low entry cost, long wait, occasionally spectacular percentage moves late. See cheap cases vs classics for the trade-off.
- Mid-age discontinued cases carried the most balanced profile: real scarcity already priced in partially, real appreciation reportedly still ahead, decent liquidity throughout.
- Old classics already made their big move. They've historically been steadier stores of value than growth plays — and their charts are the ones the highlight reels borrow.
And the thing no chart shows: all of it runs on one company's goodwill. Valve can change drop rates, trade rules, or the game itself tomorrow. Single-publisher risk doesn't show up in historical returns until the day it does, which is why the sizing advice never changes — entertainment money, satellite position, nothing you need back on a deadline.
The takeaway
The returns are real enough that the strategy earned its following, and messy enough that nobody should quote them without hedging. Historically, the money was made by boring behavior: pick liquid cases, buy small amounts constantly, hold for years, ignore the middle of the chart. That behavior is hard for humans and trivial for software, which is the entire reason automated daily buying exists — a bot doesn't get bored in the flat stretch or scared in the drawdown. It just executes the plan you set while you were thinking clearly.