How Much Has the CS2 Market Actually Dropped?
Ask five people how bad the 2026 drawdown is and you'll get five numbers, all confidently wrong in different directions. The honest answer needs a range, a date window, and a stack of caveats. Here is the damage report as the data actually supports it — what dropped, how much, and which parts of the headline numbers you should trust least.
The headline numbers, and where they come from
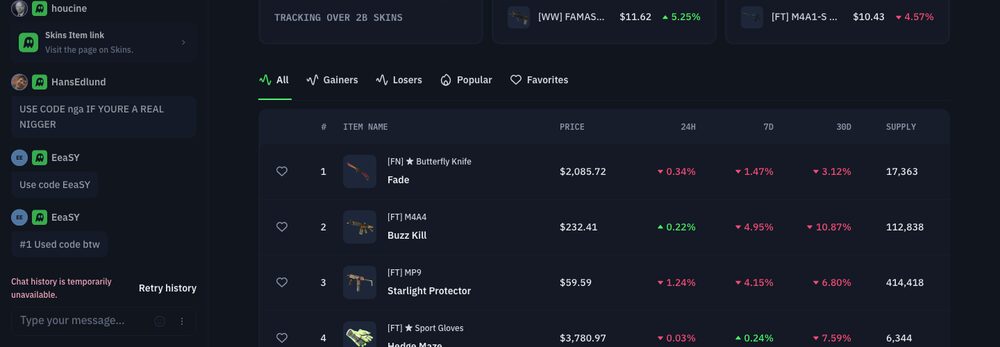
Start with the biggest one. At its peak, third-party trackers put the total market capitalization of CS2 items somewhere around $14 billion. By mid-2026, the same trackers showed that figure roughly halved — and some of the steeper methodologies printed worse than that. Nobody audits this market, so "roughly half" is the defensible summary: the precise percentage depends entirely on whose index you read and which day you read it.
The second number is arguably more important because it measures breadth rather than depth. Per one widely cited analysis, 1,128 of 1,186 tracked skins — about 95% — lost value between March and mid-August 2026. That is not a correction in one overheated corner. That is nearly the entire tracked market moving down together.
The third is the early-warning number. Gloves fell first and hardest, sliding an estimated 10–20% in early 2026 while most other segments were still flat or drifting. In hindsight, trackers treat that glove weakness as the opening act of the broader slide — we covered the segment's full story in the 2026 glove crash.
What "95% of skins down" actually means
Breadth is the statistic that separates this drawdown from ordinary volatility. In a normal month, some skins rise and some fall, and index moves net out the churn. When roughly 19 out of every 20 tracked items decline over the same five-month window, there is no rotation story to hide in — sellers outnumbered buyers almost everywhere at once.
Analysts point to a few stacked causes rather than a single villain:
- Supply expansion. The Armory system kept feeding new items into circulation, changing the scarcity math that older pricing assumed. The mechanics are laid out in our piece on case supply — 2026 partially inverted them for active items.
- The mid-May 2026 update. A drop-rate and new-case change landed mid-May, and trackers mark it as the point where a slow bleed became a broad decline.
- A confidence spiral. Once prices fell far enough for long-term holders to question the whole thesis, selling begat selling. Several analyses argue sentiment did more damage than supply — the loop we dissect in the psychology of panic selling.
It also didn't start from nowhere. The October 2025 trade-up update erased an estimated $1.75 billion in paper value in short order, and the December 17, 2025 zeroing of the Rare Drop Pool pulled 35+ cases out of circulation — two shocks that left the market nervous before 2026 even began. The full lineage is in 2026 vs every past crash.
The damage, segment by segment
Different corners of the market took the hit differently. Treat the table below as a qualitative map, not a spreadsheet — every cell is hedged to what third-party trackers broadly agree on.
| Segment | 2026 behavior (per trackers) | Notes |
|---|---|---|
| Gloves | −10–20% early, first to fall | The canary of the whole drawdown |
| Knives | Broad declines after the Oct 2025 repricing | Covered in knife prices in the crash |
| Cases | Split: new supply vs discontinued scarcity | See cases in the crash |
| Mid-tier skins | Down with the ~95% breadth figure | Few places to hide Mar–Aug |
Why the numbers overstate — and understate — the damage
Market-cap arithmetic multiplies every tracked item by its last observed price, and that method has known failure modes. We wrote a full piece on how these estimates get built; the short version is worth repeating during a crash.
It overstates damage in one sense: nobody's inventory was ever worth its marked value in cash. Realizable value always sat below headline value because of fees, spreads, and thin order books at the top end. A "50% drawdown" on paper wealth that could never be fully liquidated is real pain, but not the same as $7 billion of cash leaving anyone's pocket.
It understates damage in another: last-observed prices lag on illiquid items. A grail knife that hasn't traded since spring still carries its spring price in the index, even if the real clearing price today is far lower. Bids, not listings, tell you what things are worth in a falling market — the core argument of how to actually value a skin.
One more distortion worth naming: survivorship in the denominators. Tracked-item lists are built from things that trade enough to track, which skews every breadth statistic toward the liquid middle of the market. The 95% figure is probably a fair picture of that middle — and a blurry one of the extremes at both ends, where the cheapest commodity skins and the rarest grails live.
What didn't drop
Here is the part the doom headlines skip: the game underneath the market is fine. Player counts have stayed strong through the entire drawdown, and Valve's CS2 item revenue for 2025 exceeded $1.16 billion by public estimates — roughly 400 million cases opened at $2.50 a key, plus around $166 million in market fees. Demand for the game did not crash; the pricing of its secondary market did.
That distinction doesn't guarantee recovery — nothing does, and past crashes recovered on their own schedules or not at all. But it frames the question correctly. This is a repricing of scarcity assumptions inside a game that people still play at record scale, and whether you sell, hold, or accumulate through it should follow from a plan, not from a headline.