2026 vs Every Past CS2 Crash
The skin market has crashed before — on a banned payment item, on trade holds, on a game transition, on a patch note. Veterans of those events keep saying "we've seen this movie." Have we? Measured on depth, speed, breadth, and cause, 2026 both rhymes with its predecessors and breaks their pattern in ways that matter for anyone deciding what to do next.
Sizing the 2026 drawdown
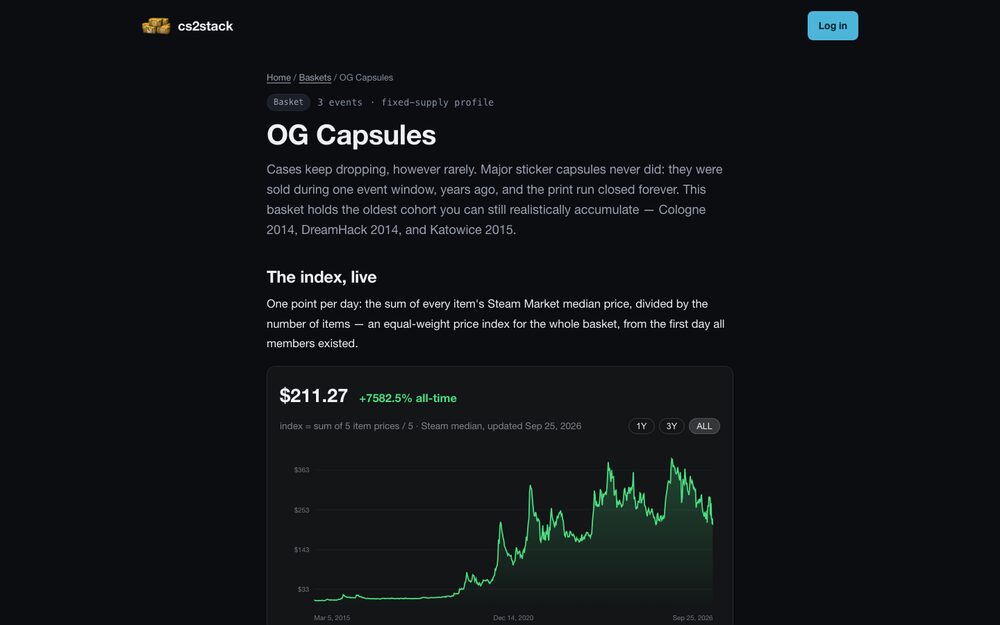
The baseline, hedged as always to third-party trackers: a market cap that peaked around $14 billion roughly halved by mid-2026 (steeper on some methodologies), with about 95% of tracked skins — 1,128 of 1,186 in one widely cited dataset — declining between March and mid-August. Gloves led, sliding 10–20% in early 2026 before the mid-May drop-rate and new-case update turned a drift into a slide. The complete numbers live in the damage report.
On raw dollar terms, that makes 2026 the largest drawdown in the market's history — though partly by arithmetic necessity: the market had never been this big, so no earlier crash could erase this much value.
The comparison table
| Crash | Trigger | Speed | Breadth | Aftermath |
|---|---|---|---|---|
| 2018 trade holds | Policy: 7-day holds | Fast | Trading-ecosystem wide | Structure changed; market adapted and grew |
| 2019 key removal | Policy: keys untradable | Overnight | Narrow but deep | Legacy keys became scarce collectibles — see the key purge |
| 2023 transition scare | CS2 uncertainty | Choppy | Moderate | Recovered as items carried over |
| Oct 2025 trade-up | Mechanic: Covert→knife trade-ups | Hours | Premium tiers | ~$1.75B paper wipe per trackers; partial adaptation — see the trade-up crash |
| 2026 drawdown | Supply + confidence spiral | Months, grinding | ~95% of tracked skins | Open |
The full ranked retrospective of the earlier events is in the five biggest crashes, ranked. What the table compresses: every previous crash was an event — a datable shock with a specific patch note behind it. 2026 is a process. Even its clearest catalyst, the mid-May update, explains the acceleration but not the five months of breadth around it.
Speed is the other axis where the shapes differ. The 2019 key removal and the October 2025 trade-up shock did their damage in hours — violent, targeted, and then over, with the rest of the market largely intact. The 2026 decline never had a single worst day; it had a worst half-year. Grinding crashes are psychologically harsher (there's no capitulation moment to mark the end) but mechanically gentler: holders got months of workable exits at progressively lower prices, where 2019's key holders got none at all.
What's the same every time
- Valve is always the weather. Every major crash traces to a Valve decision — keys, holds, trade-ups, drop rates. Single-publisher risk is the market's permanent condition, and 2026 simply restated it.
- Liquidity vanishes when you want it most. In 2019, 2025, and 2026 alike, spreads blew out exactly when holders decided to exit — the recurring theme of the holder's playbook.
- Panic outsells fundamentals. Scarce items fell alongside common ones in every episode, because capitulation sells what has a bid — the loop dissected in panic-selling psychology.
- The game outlives the crash. Player counts survived 2018, 2019, 2023 — and stayed strong through 2026 while the market halved.
What's structurally different this time
Three things separate 2026 from its ancestors. First, the driver mix: past crashes were policy shocks against stable demand, while 2026 layered a genuine supply expansion (Armory-era distribution plus the May update) on top of a sentiment collapse that several analyses rank as the bigger force. A confidence-driven decline has no single patch note to reverse.
Second, the market's size and audience changed. A ~$14 billion peak, tracked by data platforms and covered like an asset class, means more investor-type holders — and investor-type holders sell drawdowns in ways players never did. The measurement caveats got bigger with the market too: at this scale, every headline drawdown number inherits the methodology problems of measuring an unaudited market.
Third — and cutting the other way — 2026 arrived with a countervailing scarcity shock already in place: the December 17, 2025 Rare Drop Pool zeroing froze 35+ cases at fixed supply, and Valve's 2025 item revenue north of $1.16 billion (by public estimates) shows the burn engine still running. Past crashes never had a segment whose supply story improved mid-collapse — the split explored in cases in the crash.
What the precedents do — and don't — promise
The comforting read of history: every prior crash eventually gave way to new highs, and buyers who accumulated quality through the fear were rewarded. The uncomfortable read: "eventually" ranged from months to years, some sub-markets never recovered their old form (tradable keys simply ceased to exist as a market), and a sample of five crashes in one unregulated, one-publisher economy proves nothing about the sixth. History here is a map of how these things can resolve, not a schedule.
What the precedents genuinely support is a posture: crashes in this market have consistently punished forced sellers and reflex buyers, and consistently paid the patient, rule-bound, and solvent. Whether that means exiting, holding, or accumulating is your call to make with a framework — but whichever it is, the sixth crash is the wrong time to improvise. The traders who came out of 2019 and 2025 intact weren't the ones who predicted those shocks; they were the ones whose position sizes and written rules didn't require predicting anything.