What Steam Market Volumes Say About the Crash
Every headline about the 2026 crash quotes a price: the market cap that roughly halved, the case that gave back two years of gains. Almost none of them quote a volume. That's backwards. Price tells you where the last trade printed; volume tells you whether anyone is still in the room. And through the worst drawdown in skin history, the room stayed remarkably full.
Price is a headline. Volume is the market.
A market can fall 50% in two very different ways. In the first, holders dump into real bids: millions of items change hands, every seller finds a buyer at the new price, and ownership migrates from weak hands to committed ones. In the second, bids simply vanish: a handful of desperate sales mark the whole market down, and most "value" evaporates without a single trade. The first is a repricing. The second is an abandonment — the kind of death spiral that ends markets rather than resetting them.
By the numbers third-party trackers publish, 2026 has looked much more like the first. Per those trackers, roughly 95% of 1,186 monitored skins fell between March and mid-August — breadth as total as any crash on the all-time list — yet daily sales counts on liquid items stayed high through the entire slide. Skins didn't stop trading. They traded constantly, at lower prices.
The unboxing engine never turned off
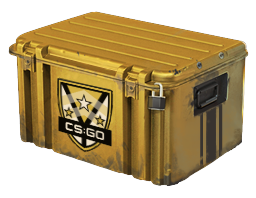
The most striking activity number isn't from the resale market at all. Per third-party analyses of drop data, players opened on the order of 400 million cases in 2025 — roughly a billion dollars of key revenue — and unboxing continued at scale straight through the 2026 drawdown. Every one of those openings is a player paying $2.50 for the thrill of a random outcome, crash or no crash.
That matters because unboxing is the skin economy's primary demand at the source: it consumes cases (permanently, per the burn mechanics), mints new items into inventories, and signals that the underlying entertainment product still commands wallets. A market where prices fall while players keep spending on the game itself is a market with a floor somewhere — the open question is only where. The same divergence shows up in engagement data: player counts held near record levels while prices halved, which per public trackers has few precedents in this market's history.
High-volume selloffs vs the low-volume bleed
Traders in every asset class read the same two patterns, and they're worth learning for skins:
- High-volume decline. Heavy selling meets heavy buying at falling prices. Painful for holders, but structurally healthy: liquidity survives, spreads stay tight, and inventory ends up with buyers who chose these prices. Recoveries start from this posture.
- Low-volume bleed. Prices drift down on thin trade because buyers have left. Spreads widen, listings pile up, and every forced sale gaps the price. This is the pattern that preceded the worst stretches of past crashes — and the one to actually fear.
- Capitulation spike. A burst of volume at the lows as the last stubborn holders finally sell. In hindsight these spikes often sit near bottoms; in real time they're indistinguishable from "more downside coming," which is why bottom signals only work as a cluster, never alone.
The 2026 crash has mostly printed the first pattern, punctuated by capitulation-shaped bursts after each policy shock — the December 2025 drop-pool change, the May 2026 adjustment. What it has not shown, per the tracker data available, is a sustained buyer strike. Someone bought every one of those panic sales. At half price, that someone was often quite happy to.
The house counted every trade
There's a darkly funny corollary: because Steam takes roughly 15% of every Community Market sale, crash volume is revenue. Every panic exit, every dip buy, every nervous round trip paid Valve's fee machine on the way through — per third-party analyses, marketplace fees alone earned Valve something like $166 million in profit in 2025, and 2026's volatility kept the meter running. The fee structure (a 5% Steam cut plus a 10% CS2 cut) doesn't care whether prices rise or fall, only that items keep moving. They kept moving.
For holders, the same fact reads as reassurance of a different kind: the platform operator earns from an active market, not a dead one. Throughput is the metric Valve gets paid on, and throughput held.
What to watch from here
If you're tracking recovery odds rather than headlines, watch activity, not price screenshots. Daily sales counts on liquid benchmarks — active-drop cases, popular mid-tier skins — falling toward zero would be the genuine alarm. Listing depth that grows while sales shrink means sellers outnumber buyers at current prices; the reverse means absorption. Spread behavior on liquid items is the quiet tell: tight spreads mean market makers still trust the venue. So far, all three have stayed on the healthy side of the line.
The same three dials, as a watchlist:
| Signal | Healthy reading | Alarm reading | 2026 so far |
|---|---|---|---|
| Daily sales counts on liquid benchmarks | High and steady, even at lower prices | Falling toward zero | Held through the slide |
| Listing depth vs sales | Listings absorbed as they arrive | Depth grows while sales shrink | Absorption side of the line |
| Spreads on liquid items | Tight — market makers trust the venue | Widening, gappy prints | Stayed tight |
One caveat on sources: Steam publishes sales histories per item but no market-wide volume feed, so every aggregate number here comes from third-party trackers sampling listings and median prices. They disagree at the margins and miss third-party venues entirely. Treat the direction of their volume data as trustworthy and the precision as decorative.
None of this says prices have bottomed — volume can't tell you that, and anyone claiming otherwise is selling something. What it says is narrower and more useful: the 2026 crash has been a repricing inside a functioning market, not the abandonment of one. For anyone weighing whether now is a time to buy, that distinction is most of the answer's foundation.